Why repeated work needs its own view
Multi-story buildings repeat the same work floor after floor: framing, rough-in, drywall, paint, flooring. A schedule lists that work as hundreds of separate activities under each floor's WBS, so a Gantt chart shows every one of them on its own row. What a superintendent wants to know is simpler. Which floors are behind, and in which trade?
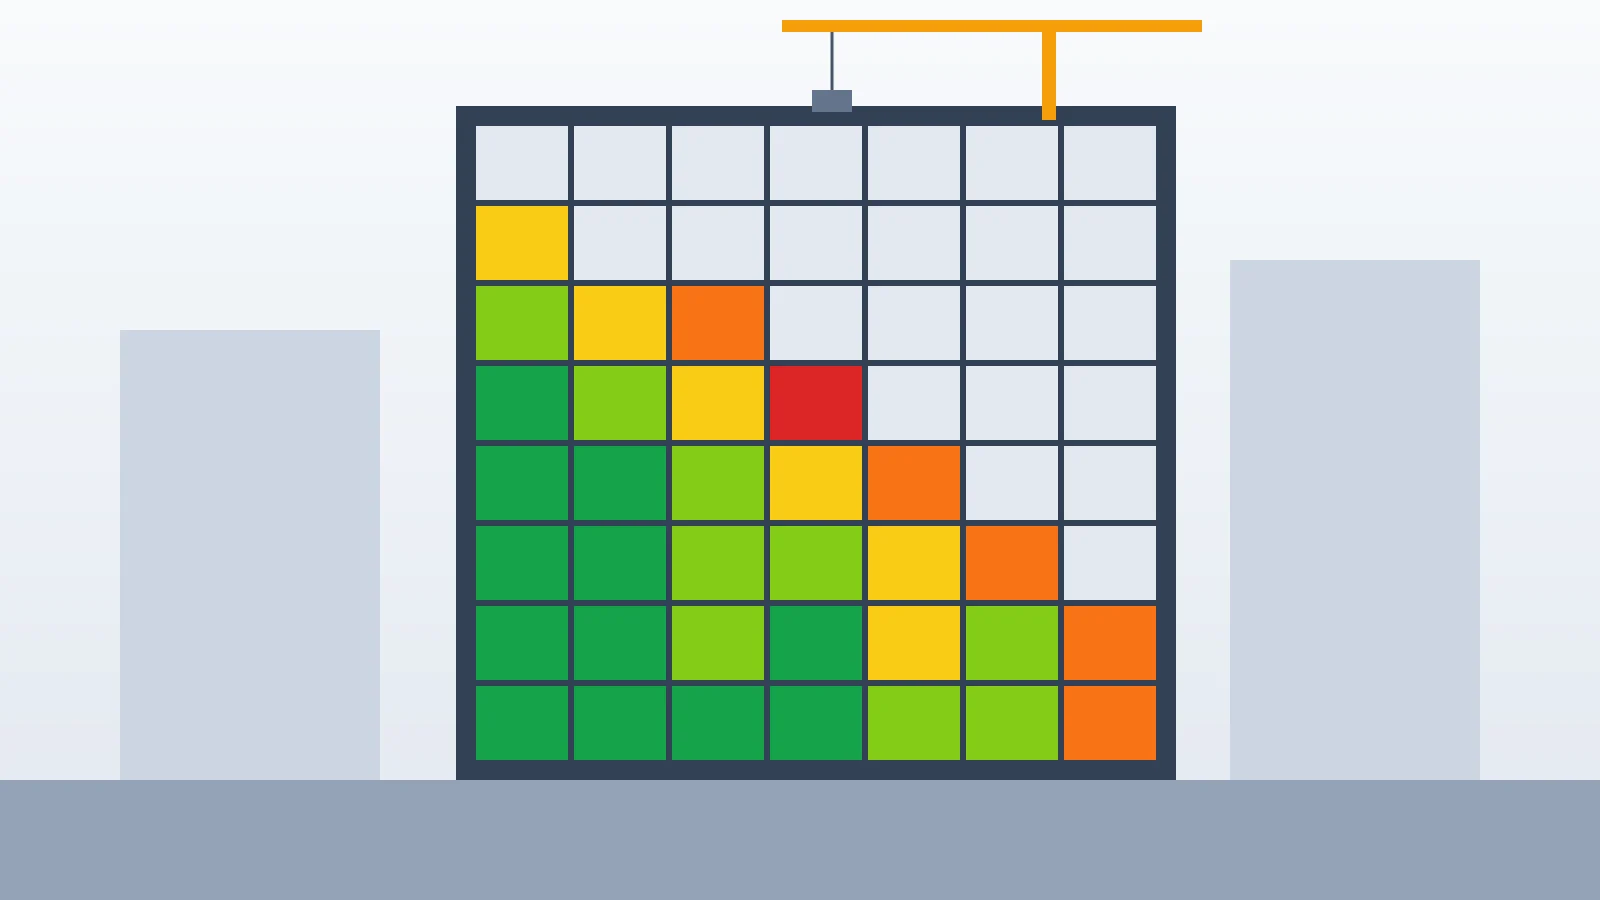
A heatmap answers that in one grid. Floors run up the side, the repeated work runs across the bottom, and each cell takes a color for how that trade is doing on that floor. A trade slipping on every floor reads as a colored column. A floor where every trade is behind reads as a colored row. Both patterns are hard to see in a long activity list.
How Pathizer builds the grid
Nothing has to be set up. Pathizer reads the schedule the Schedule Updater works from and looks for activity names that appear under two or more WBS areas. Names are compared without case or extra spacing, with a leading zero ignored and bracketed notes and the area's own name left out, so a ceilings activity named for Area 01 and the same one named for Area 02 land in one column. Each repeated name is a column.
Work under a WBS that reads as a floor or level goes on that level's row, even when units or rooms sit between the floor and the activity. Other work takes the WBS level whose names differ the most between that column's activities. Either way, drywall on Floor 4 and Floor 5 lands on the rows Floor 4 and Floor 5, whether the schedule is built floor first or trade first. Rows are ordered as a building goes up: foundations and basements at the bottom, then ground, mezzanine, numbered floors and podium levels, penthouse and roof at the top. Areas that do not read as a level sit above them in natural number order. Columns run left to right in the order the work is planned to start. Work whose name does not repeat is left off the grid, and the page says how many activities that is.
What the colors mean
Each cell shows the duration-weighted actual percent complete of its activities. By default its color shows the lowest total float of its open work, in calendar days, so the most critical work sets the color. Completed work has no total float and does not count. Colors update when a new update is published.
- Green: 31 calendar days of total float or more
- Lime: 11 to 30 calendar days
- Yellow: -10 to 10 calendar days
- Orange: -11 to -30 calendar days
- Red: -31 calendar days or less
- Gray: no open work with a total float
Update Slippage
Tick Update Slippage to color each cell by how far its finishes moved since the last update instead: the actual finish when the work is done, else the forecast finish, as a percent of each activity's own duration. A five-day slip on a ten-day activity counts for more than the same slip on a ten-week one. Work that is under way, or not due yet, stays yellow unless its finish moved, so being unfinished never reads as a delay. Milestones and work with no duration are left out of the color.
- Red: finish moved later by more than 30% of its duration
- Orange: finish moved 10% to 30% of its duration later
- Yellow: finish within 10% of its duration, or work not yet due that has not moved
- Lime: finish moved 10% to 30% of its duration earlier
- Green: finish moved earlier by more than 30% of its duration
- Gray: nothing to compare (new work, work with no duration, or finished before the last update)
Views for the field and the update meeting
Floors and levels shows the rows that read as building levels; All areas adds every other repeated area. By default the grid keeps only work in this cycle or the last update that has a finish to compare, so no gray cell is left. Work that closed in the last update still shows: work that finished more than 10% of its duration ahead of where the last update had it shows lime or green. Show Out of range adds the rest back.
Click any cell to list its activities, each with its actual percent and its total float, or under Update Slippage how far its finish moved, in days and as a percent of its duration. Color the labels gives every row and work name the color of its cells: the lowest total float, or under Update Slippage their average. The work names and the legend stay in view while the grid scrolls, and the band that holds the names can be dragged taller for long names.
The percent in each cell reads the Schedule Updater's live copy, so progress the field team saves there shows the next time the page loads. The colors compare published updates, so they change when the next update is published. It changes no schedule data. It is a view of progress, not a delay analysis: why a floor is behind is a question for the float paths and the update review.